Follow the flow. Find the context.
Look inside the tape. Filter options activity by premium, contract and aggressor, then inspect the prints behind a move.
Go beyond the price chart. Explore options flow, gamma exposure and the levels that bring the market into focus.
In your browserBuilt around your analysis

Actual Vera Charts tools. Illustrative market data.
From the index to the individual name.
MORE CONTEXT. EVERY ANGLE.
Different views of the same market. Connected in one workspace.
Look inside the tape. Filter options activity by premium, contract and aggressor, then inspect the prints behind a move.
Compare call, put and net exposure by strike. Explore concentrations across expiries and bring a different dimension to your price analysis.
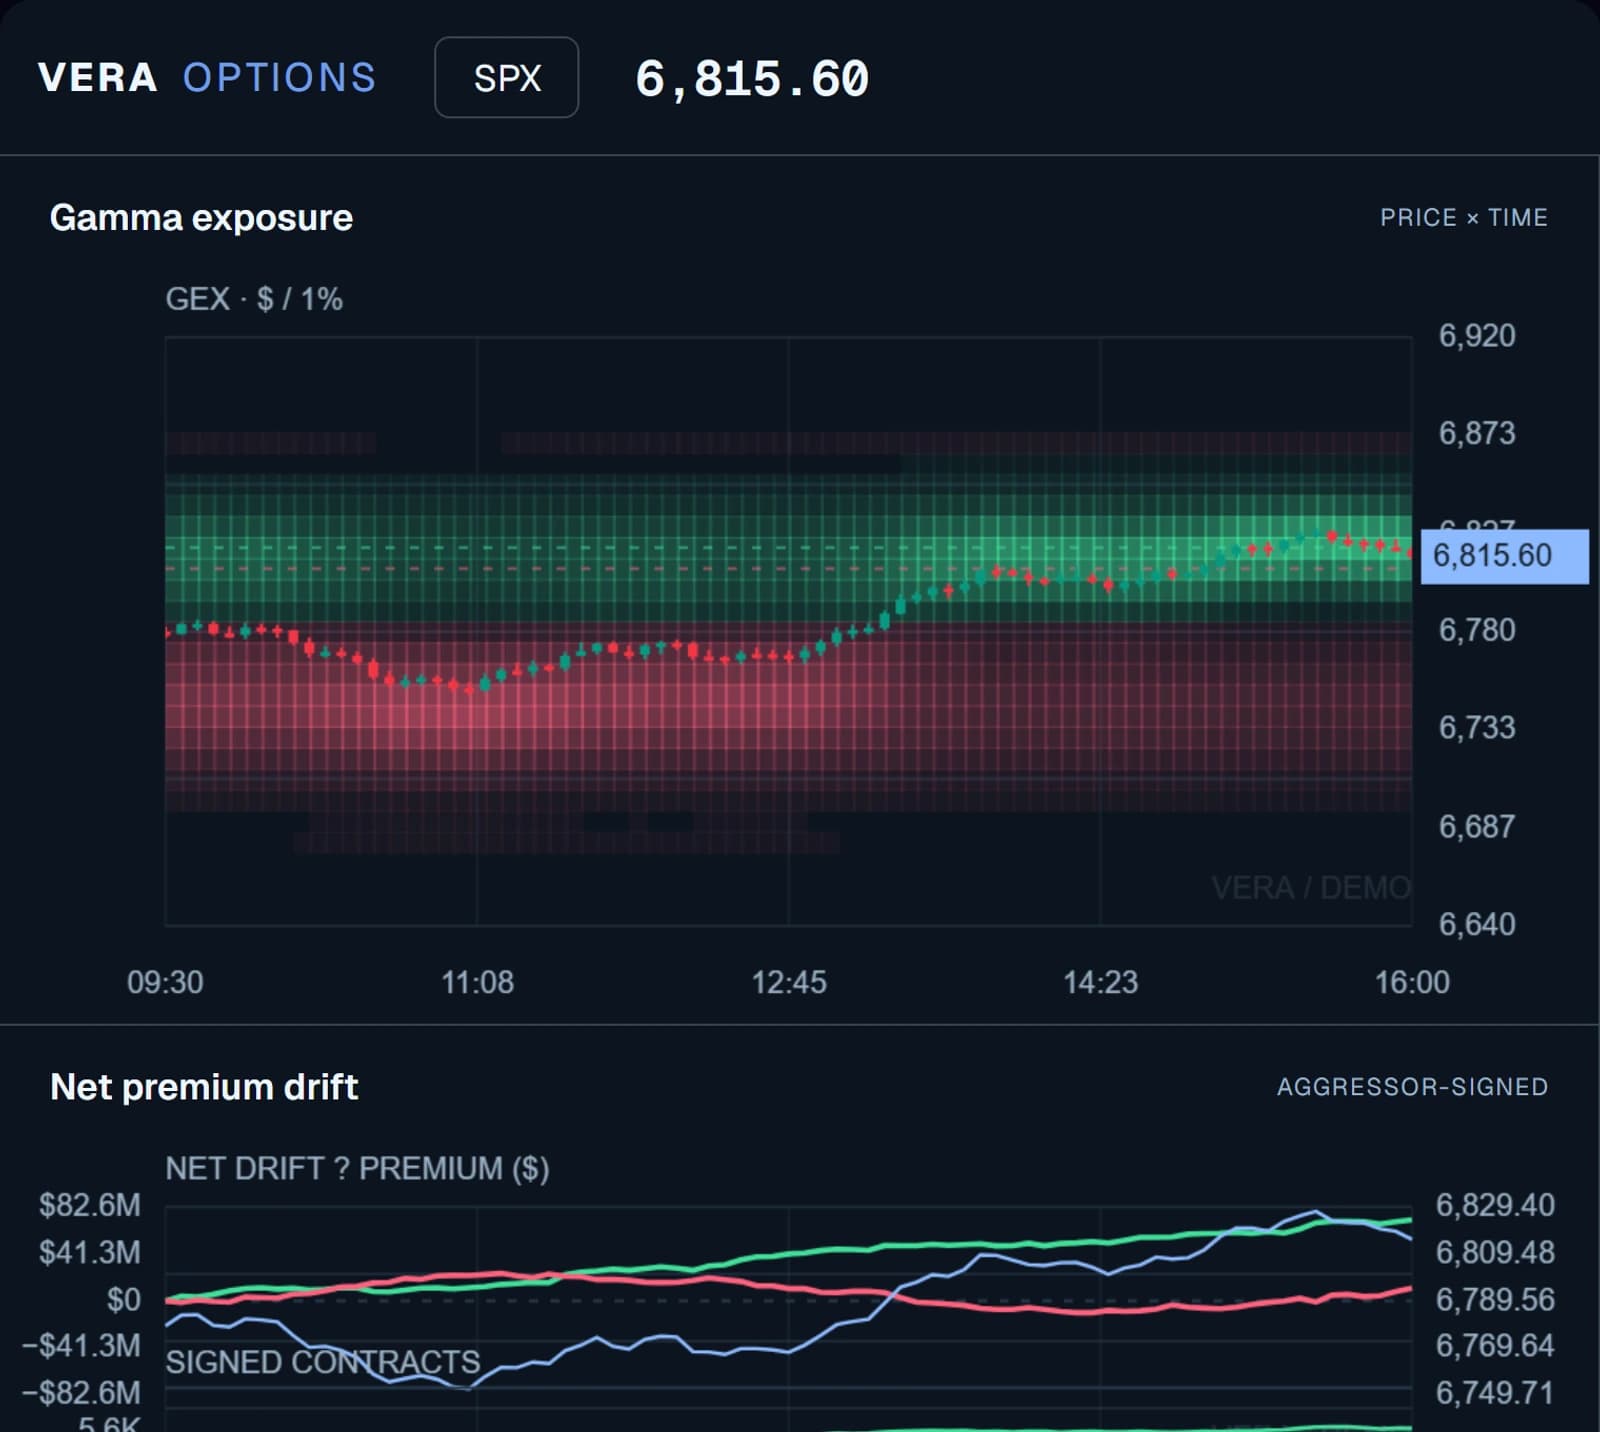
Put price and options exposure on the same timeline. Follow how concentrations evolve throughout a session with a clear, color-coded view.
GO A LEVEL DEEPER
Choose the perspective. Find the detail. Make the workspace yours.
Compare signed call and put premium as the session develops.
Track exposure at each strike, with bubble size showing its magnitude.
Rotate the surface. Explore the relationship between exposure, price and time.
Separate near-term positioning from concentrations further along the curve.
Compare outstanding call and put contracts across the strike ladder.
Choose your symbols, colors and modules. Build a workspace around your process.
TAKE THE CONTROLS
Switch symbols. Change the colors. Explore the charts yourself.

YOUR WORKSPACE STARTS HERE
Choose monthly flexibility or save with an annual plan.
$49/ month
Your workspace. On your schedule.
Get startedIncluded with your plan
Billed monthly. Cancel anytime.
$490/ year
More time in the market. Better value.
Get startedIncluded with your plan
Billed annually. Cancel renewal anytime.
Options preview access does not include a live exchange data subscription.
Anything else, ask us. Contact the team
Explore options flow, gamma and charm heatmaps, exposure by strike and expiry, net premium drift, open interest, an interval map and a 3D gamma landscape. The public product preview uses synthetic data so you can try the tools without connecting a broker.
No. The options charts and images on this page use an illustrative session. A charting subscription does not include live options exchange entitlements. The preview is for exploring the interface and analytics, not for making live trading decisions.
Exposure charts are estimates based on a model and its assumptions. They do not identify market makers or reveal their actual holdings. The options workspace includes methodology details to help you interpret each measure.
Yes. Try the interactive preview on this page to switch symbols and color palettes. Open the full options workspace to explore additional modules, expiry filters and layout controls.
Choose $49/month or $490/year. Annual billing includes two months free. Both plans include the charting workspace, indicators, drawing tools and saved layouts. You can cancel renewal from your account.
No. Vera Charts runs in your browser. You can explore the public options preview without an account, then create an account for a saved charting workspace.
Your charts. Your tools. Your perspective.